
Dashboard
How to view your agency's activity summary on the Dashboard
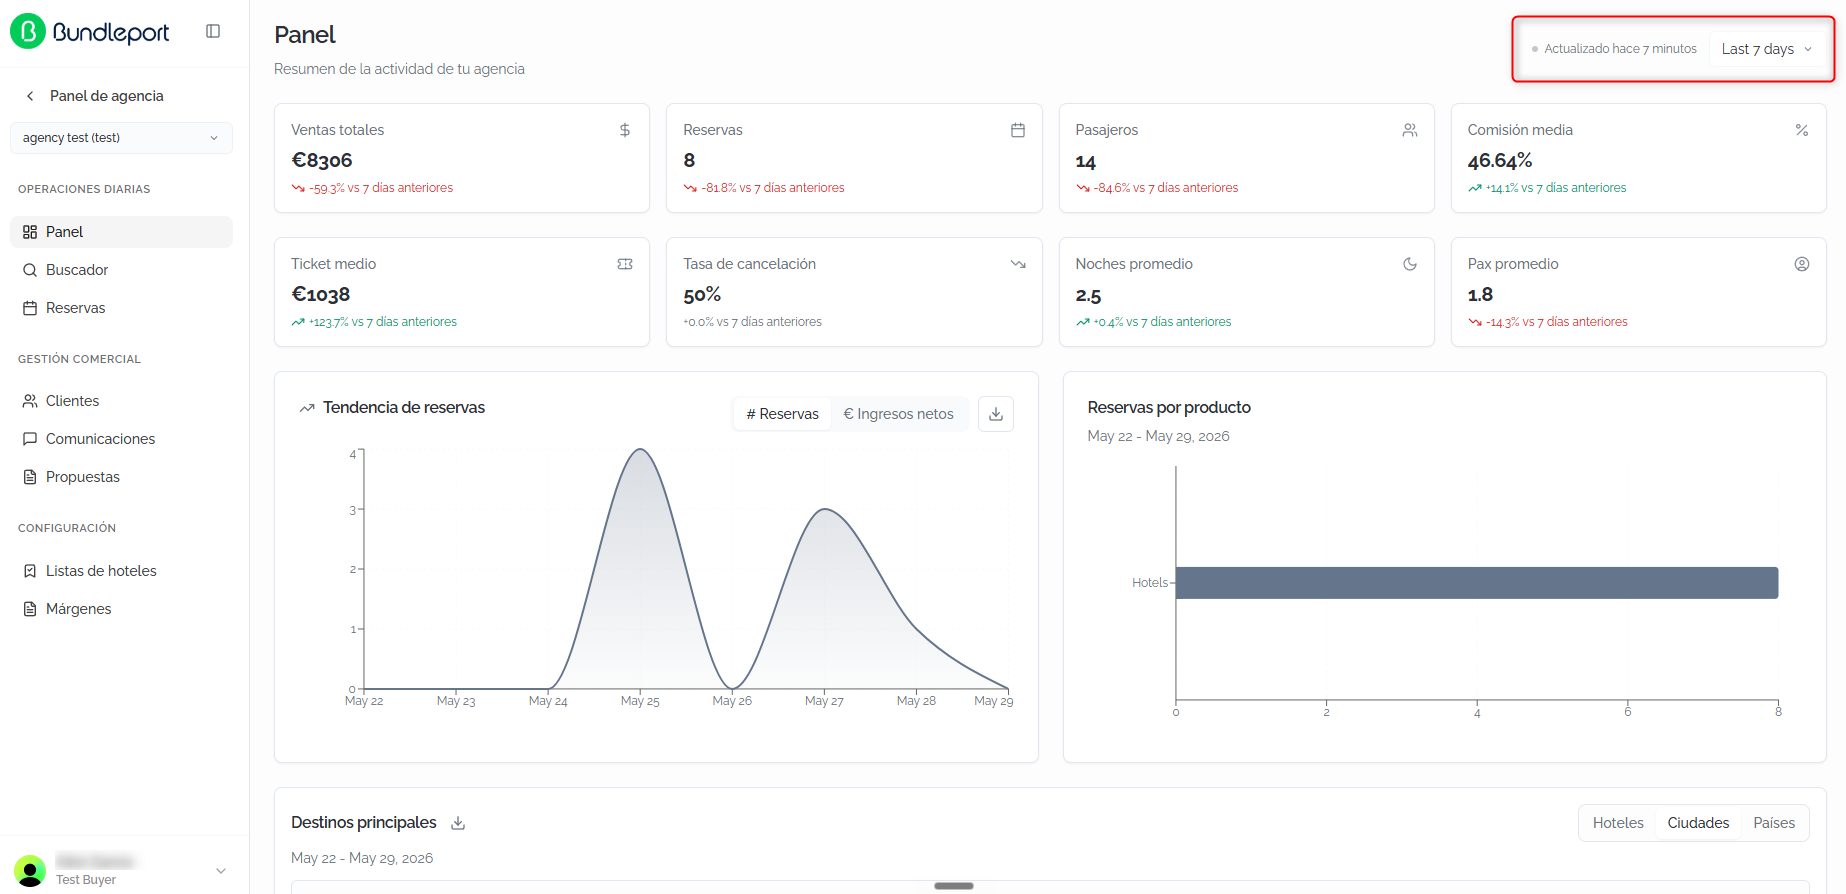
The Dashboard is the home screen of the Agency Panel. It offers a consolidated view of your business activity: key performance indicators, booking trends, top destinations, and recent bookings, all on a single screen.
Use it as your daily starting point to spot trends, identify opportunities, and keep track of operations without having to manually cross-reference data.
Accessing the Dashboard
- Log in to the Bundleport platform.
- In the left-hand side menu, select Agency Panel.
The page that opens shows the Dashboard by default.
Analysis period
In the top right corner, you'll find the time period selector. When you change it, all indicators, charts, and tables update automatically.
The available options are:
- Today: data for the current day.
- Yesterday: data for the previous day.
- Last 7 days: last 7 days (default option).
- Last 30 days: last 30 days.
- Last 3 months: last 3 months.
- Last 12 months: last 12 months.
- Custom: custom date range.
Next to the selector, you'll see the time of the last data update.
💡 Tip
Use the Custom range to analyze specific periods, such as a promotional campaign, a long weekend, or a particular season
Key performance indicators (KPIs)
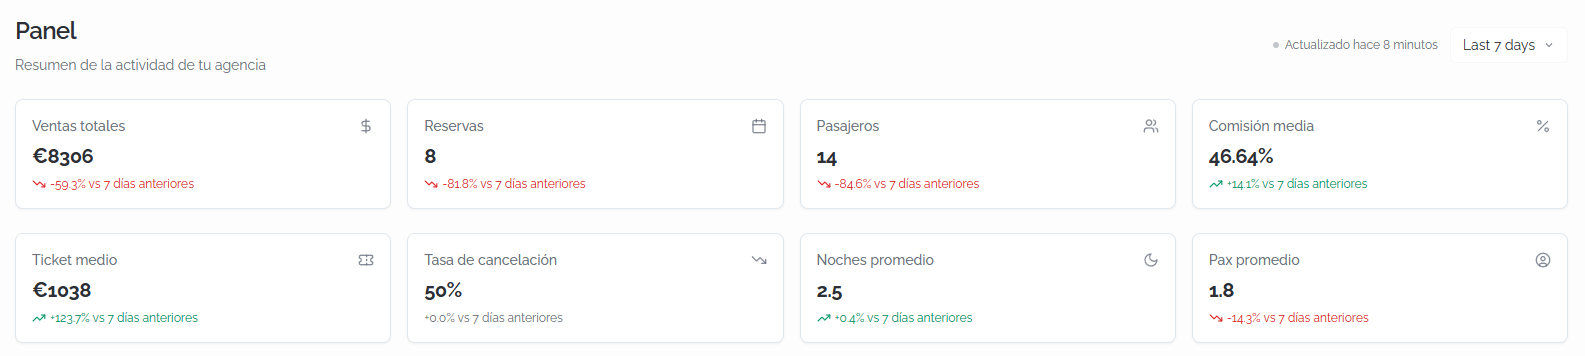
The top section of the Dashboard displays eight cards with the agency's main indicators. Each card includes the current value and the percentage change compared to the equivalent previous period.
- Total sales: total sales amount in euros.
- Bookings: total number of bookings made.
- Passengers: total number of passengers across bookings in the period.
- Average commission: average commission percentage earned.
- Average ticket: average amount per booking.
- Cancellation rate: percentage of cancelled bookings out of the total.
- Average nights: average number of nights per booking.
- Average pax: average number of passengers per booking.
Positive changes are shown in green with an upward arrow, and negative changes in red with a downward arrow, always relative to the equivalent previous period.
ℹ️ Information
The percentage change compares the selected period with the immediately preceding period of the same length. For example, if you select select Last 7 days, the change is calculated against the previous 7 days.
Charts
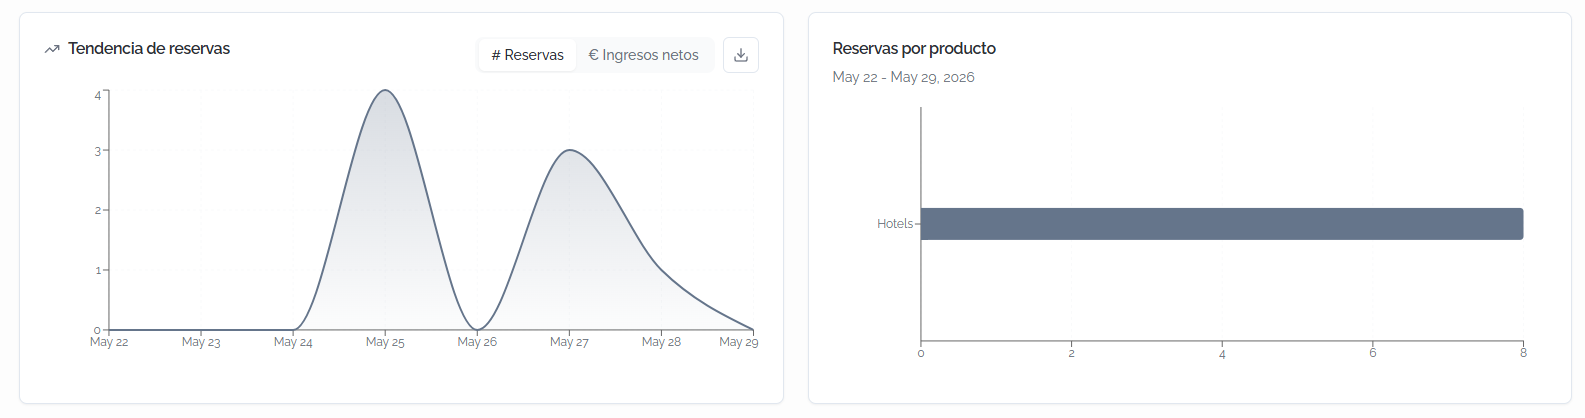
Below the KPIs, you'll find two charts:
- Booking trend: shows how bookings evolved during the selected period. You can switch between two metrics using the tabs above the chart: Bookings (number of bookings per day) and Net revenue (net amount per day).
- Bookings by product: breaks down the number of bookings by product type (e.g., Hotels).
ℹ️ Information
The data in the booking trend chart can be exported by clicking the download button in the top right corner of the chart.
Top destinations
The Top destinations section presents a table with the performance of the most relevant destinations during the selected period. You can view the data across three dimensions using the Hotels, Cities, and Countries tabs.
The available columns (each sortable) are:
- #: ranking position.
- City / Hotel / Country: destination name according to the selected tab.
- Net revenue: net revenue amount generated.
- Bookings: number of bookings.
- Searches: number of searches performed for that destination.
- Average value: average amount per booking.
- Average nights: average number of nights per booking.
- Conv %: conversion rate (percentage of searches that convert into a booking).
- Average pax: average number of passengers per booking.
- Cancel %: cancellation percentage.
- Hotels booked: number of distinct hotels booked.
The data can be exported by clicking the download icon.

💡 Tip
Sort by Conv % to identify the destinations that convert best, or by Cancel % to spot destinations with unusually high cancellation rates that may need attention.
Recent bookings
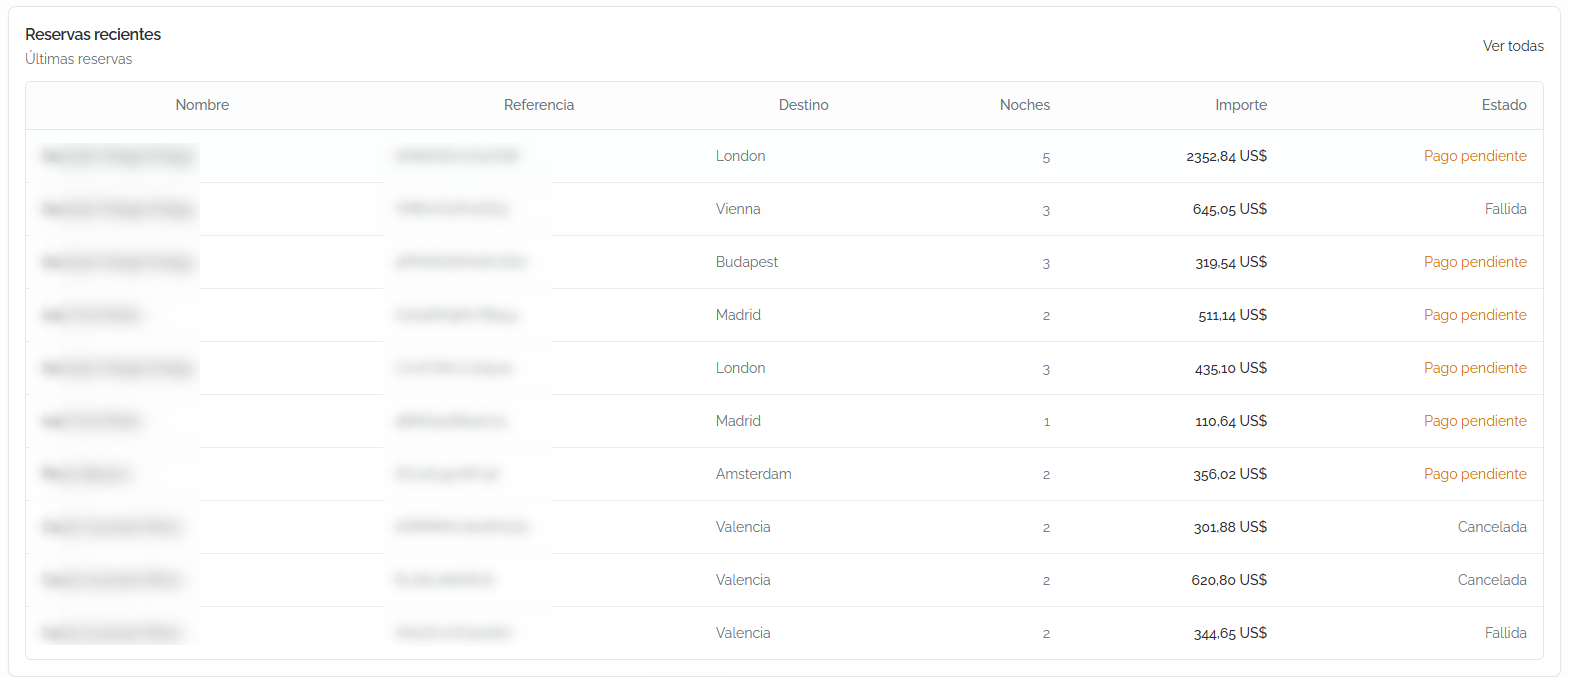
The Recent bookings section shows a list of the agency's most recent bookings. Each booking includes the following information:
- Name: booking holder.
- Reference: Bundleport reference code.
- Destination: address or name of the accommodation.
- Nights: number of nights of stay.
- Amount: total price in euros.
- Status: current booking status (e.g., Confirmed, Cancelled, Failed, Payment pending).
Click View all in the top right corner to access the full list of bookings.
FAQs
How often is the Dashboard data updated?
The data is updated every time you access the page. Next to the period selector, you'll see the time of the last update so you know how recent the data you're viewing is. If you want to refresh the data, you can reload the page.
What analysis period is shown by default?
The Dashboard loads data for the last 7 days (Last 7 days) by default. You can change it at any time using the period selector in the top right corner.
Can I export the Dashboard data?
Yes. The booking trend chart and the top destinations table include a download button to export the data. You can also download the bookings list from the Bookings page.
Why don't I see data for a certain indicator?
If an indicator shows a value of zero or doesn't appear, it means there's no recorded activity for the agency for that item during the selected period. Try widening the date range.
What does the percentage change in the KPIs mean?
It compares the value for the selected period with the previous period of the same length. A green change with an upward arrow indicates improvement, and a red change with a downward arrow indicates a decline.
What is the Conv % column for in Top destinations?
The conversion rate measures the percentage of searches that convert into a booking for each destination. It lets you identify which destinations generate the most business relative to the number of searches performed.